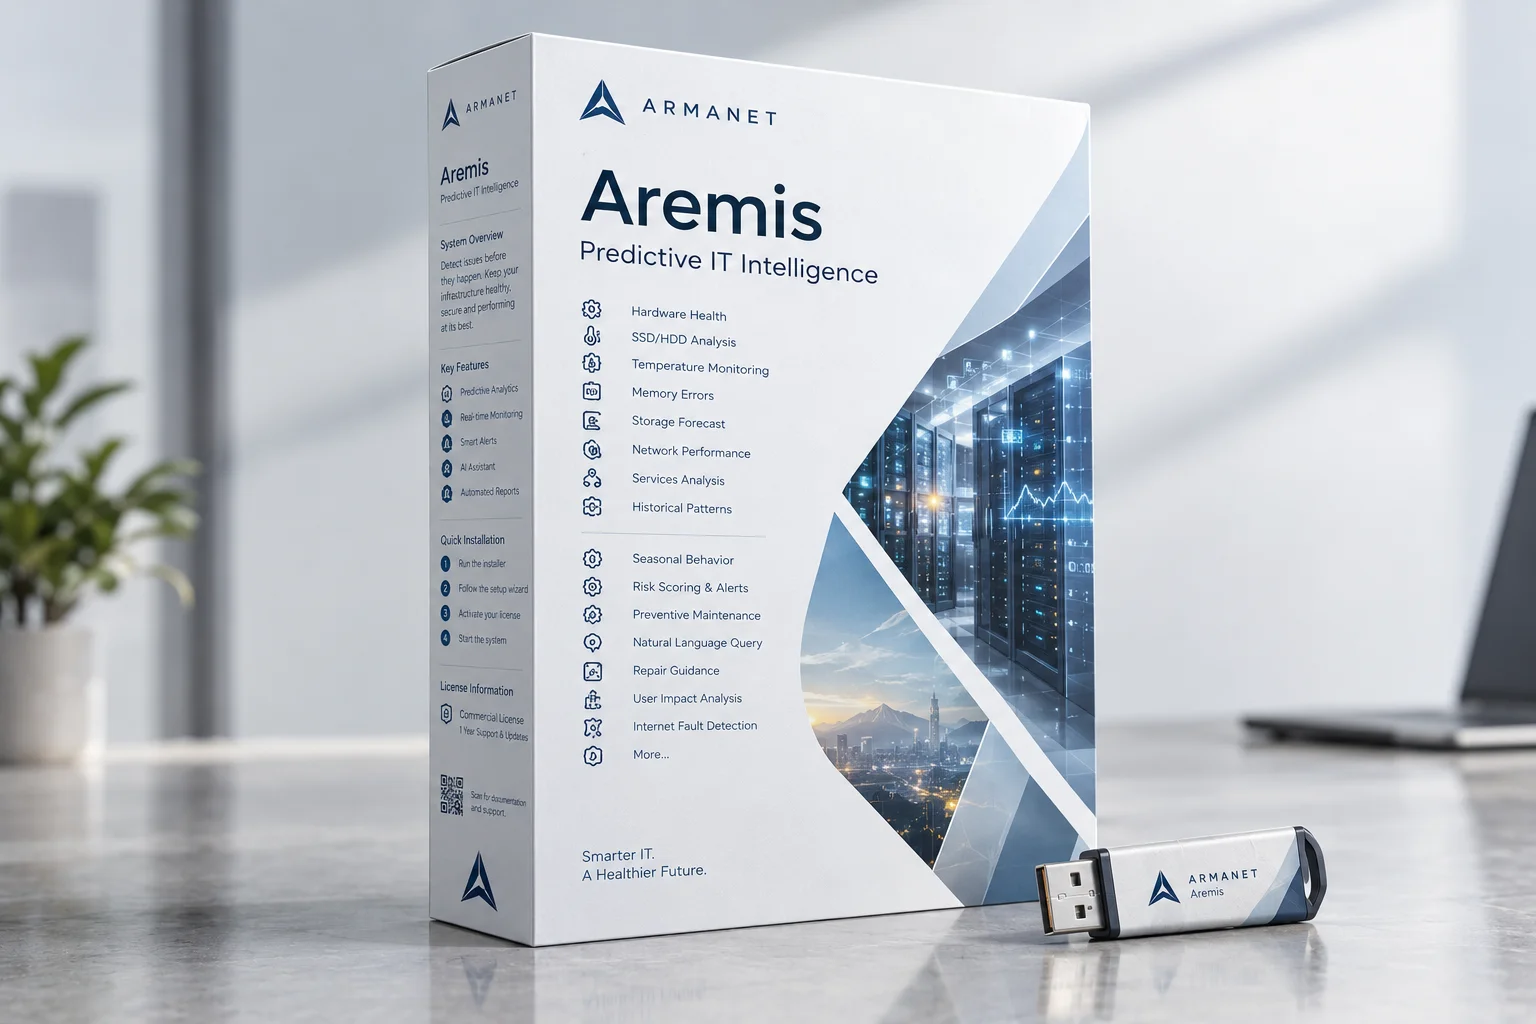
Aremis is the ARMANET predictive IT intelligence system — an AI layer that monitors your entire infrastructure and tells you what will break, when it will break, and how to prevent it. Before the crash. Before the user complaint. Before the downtime.
The Paradigm Shift
Traditional IT monitoring waits for thresholds to be crossed — CPU at 95%, disk at 90%, service down — then fires an alert. By that point, the damage is already done. Aremis reverss this entirely: it analyzes patterns, trends, and historical behavior to predict failures while the system is still healthy, giving your team time to act before anyone notices a problem.
The result: IT operations shift from firefighting to prevention. Downtime drops. User complaints disappear. And your team spends time improving infrastructure instead of repairing it.
Hardware Failure Prediction
Every component in your infrastructure is monitored continuously: CPUs, RAM modules, SSDs, HDDs, network interface cards, power supplies, temperature sensors, and fans. Aremis learns what normal behavior looks like for each specific device — under its specific workload, in its specific environment — and detects the subtle deviations that precede hardware failure.
The prediction window ranges from 24 to 72 hours for most failure types, giving your team sufficient time to schedule maintenance, migrate workloads, or replace components — without urgency, without disruption, without downtime.
SSD and HDD Health Analysis
Aremis reads and interprets SMART data from every drive in your infrastructure. For SSDs: wear leveling, program/erase cycles, reserved block consumption, and controller temperature. For HDDs: bad sector growth, read/write error rates, seek time degradation, and spin-up anomalies.
The system does not just report current health — it builds degradation curves over time and extrapolates remaining useful life. A drive that shows 95% health today but is declining at 2% per week is flagged as critical, because it will fail long before the 90% threshold triggers a traditional alert.
Thermal Intelligence
Abnormal heating is one of the earliest indicators of hardware failure — often appearing days or weeks before the component stops working. Aremis monitors temperature sensors across servers, storage arrays, and network equipment, building thermal profiles for each device.
The system distinguishes between three patterns: normal load-based heating (expected), environmental heating (room temperature issues), and pathological heating (component degradation). Only the third triggers a predictive alert — with the affected component identified and repair guidance attached.
Memory Error Analysis
RAM does not fail suddenly — it degrades gradually. Correctable ECC errors increase in frequency before uncorrectable errors appear. Aremis tracks correctable error rates per memory module and detects the exponential growth pattern that indicates a failing DIMM.
When a module crosses the predictive threshold, the system identifies the exact physical slot, recommends replacement timing, and estimates the risk of continued operation — giving your team the data to make an informed decision about maintenance scheduling.
Storage Capacity Forecasting
Aremis does not tell you the disk is 90% full. It tells you the disk will be full in 9 days at the current growth rate, identifies which directories or applications are consuming the growth, and recommends the specific cleanup or expansion action to take.
Capacity forecasting uses historical growth patterns adjusted for seasonal behavior — month-end database growth, backup cycles, log accumulation rates — to produce accurate predictions rather than simple linear extrapolation.
Network Performance Prediction
Users feel network degradation before monitoring tools detect it. Web pages load slower. File transfers take longer. Video calls stutter. By the time traditional monitoring crosses an alert threshold, users have been complaining for hours.
Aremis analyzes latency, packet loss, throughput, and jitter trends across every network segment. It detects the gradual degradation pattern that precedes bandwidth exhaustion, interface failure, or routing issues — and alerts before users experience the impact.
The system also distinguishes between internal network problems (switch, router, cable) and external connectivity issues (ISP, upstream provider). When the internet is down inside the network, Aremis identifies the exact hop where connectivity is lost — with diagnostic steps to resolve it.
Service Degradation Detection
Services rarely fail suddenly. They degrade: response times creep upward, error rates drift higher, restart frequency increases. Traditional monitoring catches the crash. Aremis catches the degradation curve.
The system tracks every service response time, error rate, and restart pattern. When a service shows a consistent upward trend — even if it is still within normal thresholds — Aremis flags it as degrading, with a predicted time-to-failure estimate and root cause indicators.
Historical Pattern Analysis
Every infrastructure has rhythms: backup jobs at 2 AM, month-end database growth, weekly reporting spikes, seasonal traffic patterns. Aremis learns these rhythms and uses them as context for anomaly detection.
A 60% CPU spike at 3 AM on the first of the month is normal. The same spike at 3 AM on a random Tuesday is an anomaly. Without historical context, both look identical. With Aremis, only the second triggers an alert.
Risk Scoring and Prioritization
Every device in your infrastructure receives a continuously updated Failure Risk Score from 0 to 100. The score combines hardware health indicators, environmental conditions, workload stress, and historical failure patterns for that device class.
Your team sees a single ranked list: which servers are at highest risk, which storage arrays need attention, which network segments are degrading. No alert fatigue. No noise. Just prioritized action items.
Preventive Maintenance Recommendations
Aremis does not just tell you what is wrong — it tells you what to do. Every predictive alert includes specific, actionable recommendations: replace DIMM in slot 3 within 48 hours, migrate workload from server 12 by Friday, clean air intake on rack 4, add 2TB to storage array 2 before month-end.
Recommendations are prioritized by risk score and business impact, so your team always knows what to do first.
Natural Language System Queries
Through the Foblax research partnership, Aremis supports Arabic-language system queries. Your team asks questions in Arabic — and gets structured, accurate answers with repair steps.
Which server has the highest failure risk? What is the health status of storage array 2? Which users are experiencing slowness? Why is the network degraded? Each question returns a direct answer with data, not a dashboard to navigate.
User Experience Monitoring
When a user says the system is slow, the question is: why? Aremis identifies which users are experiencing degraded performance and correlates their experience with infrastructure metrics. The result is root cause identification — not just symptom detection.
User: Ahmed is experiencing 3-second login delays. Cause: storage array 2 latency at 40ms (normal: 8ms). Recommendation: replace failing SSD 7 on array 2.
On-Premise Architecture
Aremis runs on your infrastructure, monitoring your infrastructure. No cloud dependency. No data leaves the network. The monitoring layer, the analysis models, and the alert system all operate inside your perimeter.
For government, banking, and defense installations where infrastructure data is classified, this is the only acceptable architecture.
Part of the ARMANET Platform
Aremis monitors the servers and network that run every other ARMANET product. When ARVORA processes vehicle analytics, Aremis monitors the health of the server running it. When NAREX detects security events, Aremis ensures the infrastructure can deliver those alerts. It is the health layer of the entire platform.
Who It Is For
- Enterprise data centers: Predict hardware failures, prevent service downtime, and eliminate reactive firefighting.
- Government IT departments: Monitor critical infrastructure with Arabic-language queries, on-premise, with zero data leaving the network.
- Banks and financial institutions: Prevent downtime in transaction processing, ATM networks, and core banking systems.
- Hospitals and healthcare: Ensure 24/7 availability of patient systems, medical records, and diagnostic equipment.
- Factories and industrial: Monitor production-critical servers, MES systems, and SCADA infrastructure.
- Universities and research: Track campus networks, research clusters, and shared computing infrastructure.
The Competitive Position
International AIOps platforms — Datadog, New Relic, Dynatrace — offer predictive monitoring, but they require cloud connectivity, process infrastructure data on foreign servers, and provide English-only interfaces at enterprise pricing. Aremis eliminates all three constraints: fully on-premise, Arabic-first, and priced for the Egyptian market.
No competitor in the regional market offers predictive IT intelligence. Aremis is the first — and the only one that speaks your language.