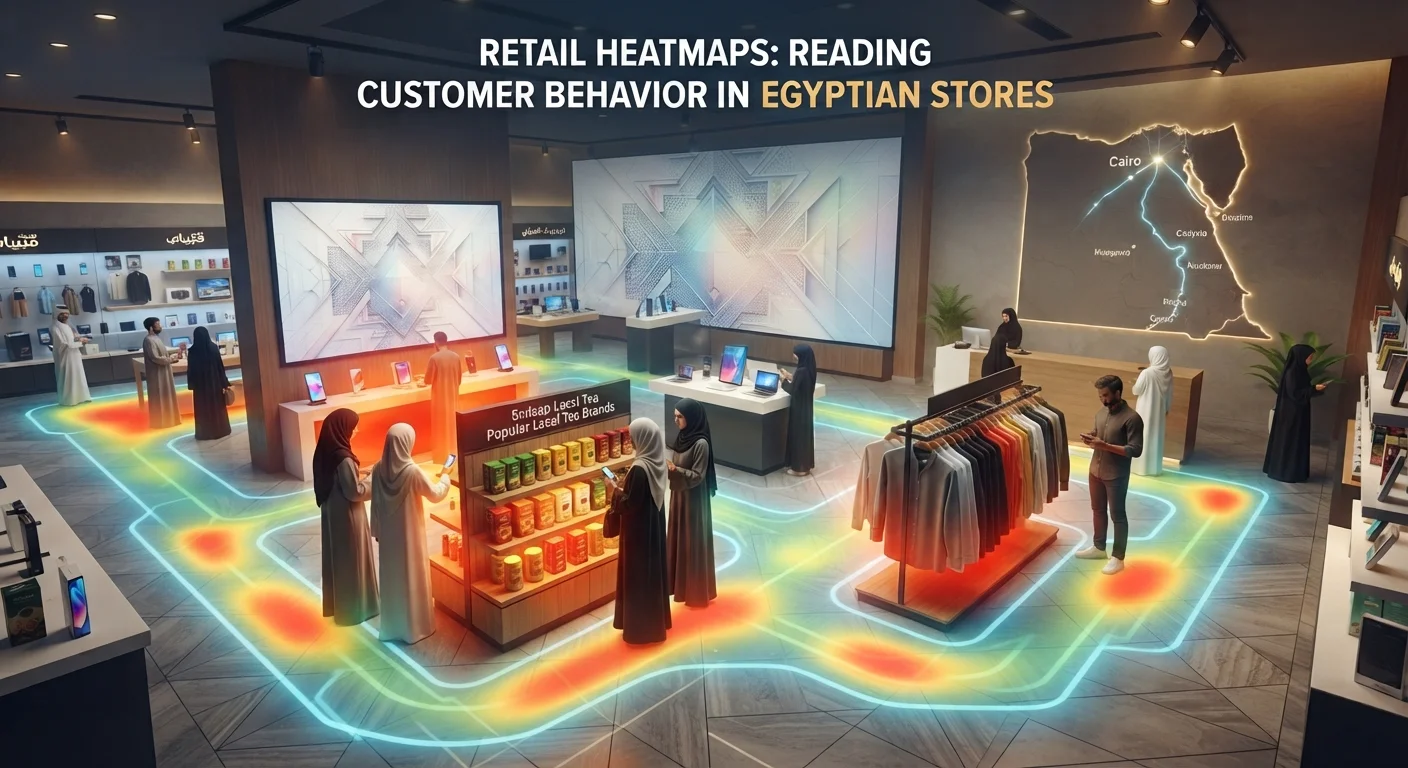
Egyptian retail chains operate in a market where expansion is rapid, rent per meter is rising, and every branch is expected to justify its cost line. In this environment, layout decisions based on personal judgment carry a price the organization pays silently — through dead zones, misplaced high-margin products, and checkout flows designed against the natural path of the customer.
The cameras installed across these branches already record everything required to remove that judgment gap. A heatmap converts existing footage into a floor plan painted by real visitor movement — where customers walked, where they stopped, and what they passed without noticing. The result is a factual basis for every layout, staffing and merchandising decision the chain makes.
Every Square Meter Is Rented. Not Every Meter Sells.
Retail rent does not distinguish between zones. The corner no customer reaches pays the same per meter as the aisle beside the entrance. A layout decision taken without movement data is therefore not a minor choice — it places the full annual rent of that space on an assumption, repeated across every branch in the chain.
The map removes the assumption. It presents, per branch and per zone, the actual movement pattern of visitors — the foundation of the measurement layer we described in how existing cameras become a business intelligence source.
The Five Signals a Heatmap Delivers
Reading a heatmap is a management exercise, not a technical one. Each pattern on the map translates directly into a business signal.
| What the map shows | What it means | The decision it changes |
|---|---|---|
| Dense red concentration | Natural attraction — customers gather without prompting | Position high-margin products at the point of proven pull |
| Heavy flow with no stops | A transit corridor — visitors pass through | Reserve the zone for signage and offers, not premium merchandise |
| Long dwell with low conversion | Interest without decision — hesitation at the shelf | Define it as a staff intervention point with clear timing |
| Cold zone | Dead space — rented, lit and producing nothing | Re-layout, re-purpose or deliberately activate the zone |
| Crowding at a single entrance | Entry pressure, not customer interest | Open a second access path before adding a second register |
The Financial Impact of One Corrected Layout
Heatmap decisions become credible when they meet the numbers. The following is a conservative calculation model for a single Egyptian retail branch.
| The assumption | The figure |
|---|---|
| Monthly visitors to the branch | 40,000 |
| Current conversion rate | 22% |
| Conversion after layout correction | 23% — one single point |
| Additional completed purchases per month | 400 |
| Average basket value | 350 EGP |
| Additional annual revenue — one branch | 1,680,000 EGP |
The model scales linearly with branch count — which is precisely why chains, not single stores, are the primary beneficiaries of heatmap-driven layout correction.
Why the Egyptian Market Raises the Stakes
Three conditions specific to the Egyptian retail sector increase the cost of operating on instinct. First, rent and operating expenses per meter continue to climb, making every unproductive zone more expensive every quarter. Second, chains are opening branches across governorates while customer behavior differs significantly by district — the layout that performs in one location does not automatically transfer to another, and copying floor plans between governorates is a documented source of lost conversion. Third, competition has shifted toward customer experience, where aisle friction and queue pressure directly move satisfaction scores and repeat visits.
The data quality behind the map carries a guarantee that matters at chain scale: counts exclude staff movement. Footfall that includes employees crossing their own aisles is noise, not data — the same discipline of separating workforce from visitors we applied in measuring the true cost of attendance fraud.
Deployment Without Construction
The layer operates on the camera network the branches already run. No hardware at the shelf, no rewiring, no branch closures for installation. First maps go live within days, after which the comparison cycle begins — branch against branch, season against season, layout against layout. The wider argument between passive recording and active analytics we set out in CCTV vs Video Analytics reaches its clearest financial form here: the heatmap is where the difference starts paying rent.
Local Delivery Inside the Egyptian Market
Heatmap programs succeed or fail on configuration and follow-up — zone definitions, branch benchmarks and Arabic reporting — which makes local delivery a requirement, not a preference. ARMANET operates from inside the Egyptian market, with deployment and support teams across Cairo, Alexandria and the Delta, and strategic partnerships with Vodafone and Etisalat Misr covering the connectivity layer. Questions about a specific zone in a specific branch are answered by a team working in the same market, not by a remote ticket queue.
The most expensive square meter in an Egyptian store is not the one facing the entrance. It is the one paying full rent and producing nothing.
Where to Start
The entry point is deliberately small: one branch, one floor plan, one camera layout. In a single session, the ARMANET team in Egypt presents the heatmap that branch is already generating, the dead zones it is currently renting, and the highest-value layout correction available this season.
Book a demo with ARMANET and put branch layout decisions on measured ground before the next season.